Burndown
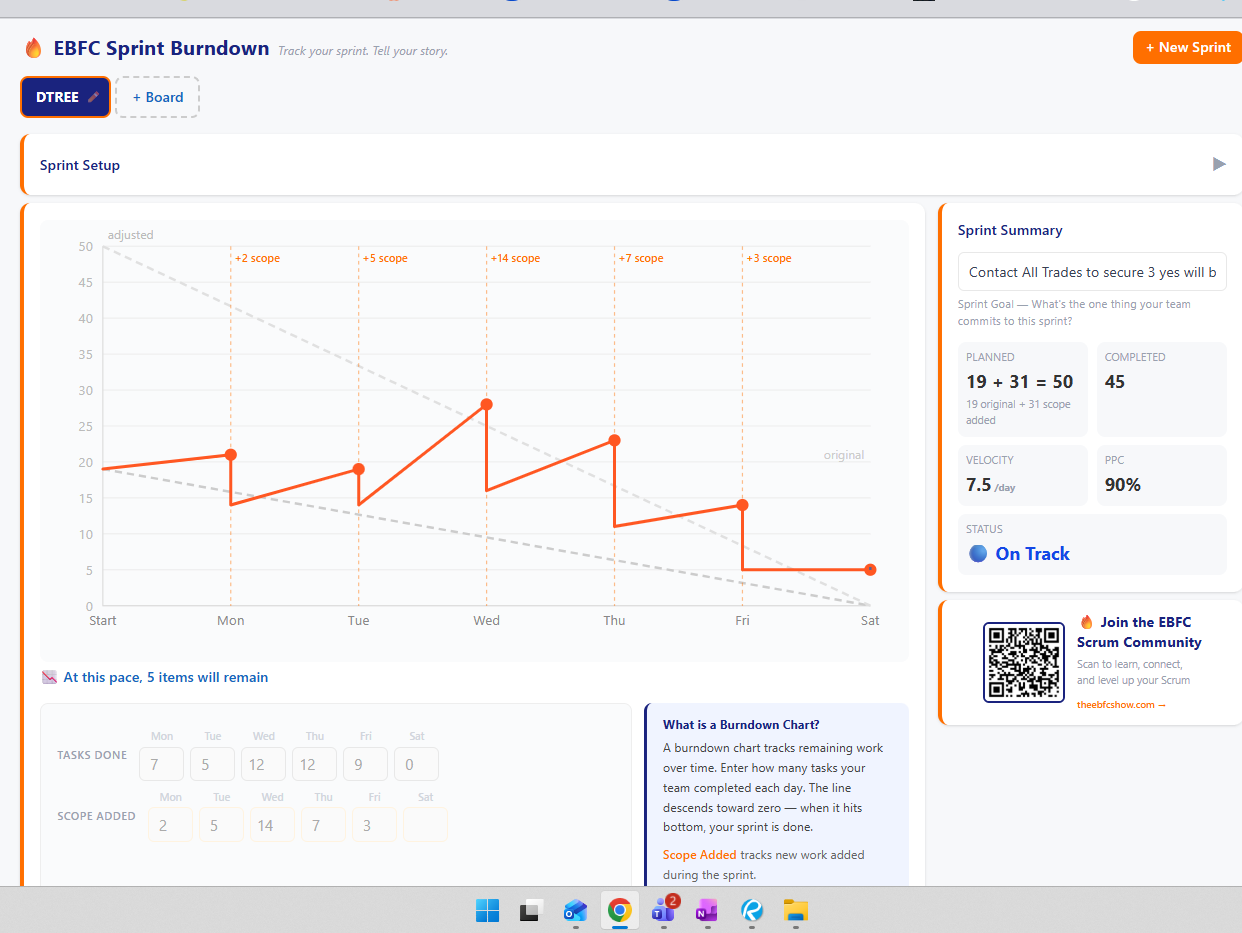
Felipe, I wanted to share my experience using the burndown chart. Here's a shot of my first burndown chart I used for a precon project weekly sprint from last week. I learned my average task per day is (45 completed / 5 days = 9 per day.) Also see the big swings with tasks added. I started with 19 on Monday and added 31 through the week. This tells me I need to do better at planning or have buffers to do unexpected work. Thanks for providing this for us.
Brian!!!! Thank you for sharing. This is so insightful and I'm so very happy you entered the full plan, do, check, act cycle of improvement. Super Scrum!!!
Felipe, I would recommend adding an indicator for the remaining items left to complete for the sprint. Or have a horizontal line indicator on the graph. See picture. Thank you for sharing this.